Drawing barplots
The incenp.plotting.bar module provides a barplot function
intended to facilitate the creation of bar plots from multi-indexed data.
The module uses the same notion of tracks and subtracks as the
incenp.plotting.scatter module.
Sample data
Let’s create a multi-indexed DataFrame which we will use in the examples below:
index = pd.MultiIndex.from_arrays([
        ['foo'] * 2 + ['bar'] * 2 + ['baz'] * 2 + ['qux'] * 2,
        ['one', 'two'] * 4
    ],
    names=['first', 'second']
    )
df = pd.DataFrame(np.random.randint(0, 100, size=(8,2)),
                  index = index, columns=['A', 'B'])
This creates a DataFrame with 2 columns (A and B) and 8
rows, indexed in two levels (level first, with 4 distinct values
foo, bar, baz, and qux; and level second, with 2
distinct values one and two).
Quick start
Here is a quick example illustrating the main points of the barplot
function (ax is supposed to be a matplotlib.axes.Axes object):
barplot(ax, df, column='A',
        tracks=['foo', 'bar', 'bax'],
        subtracks=['one', 'two'], subtrackname='second',
        ncolumn='B')
ax.legend(['one', 'two'], loc='upper center')
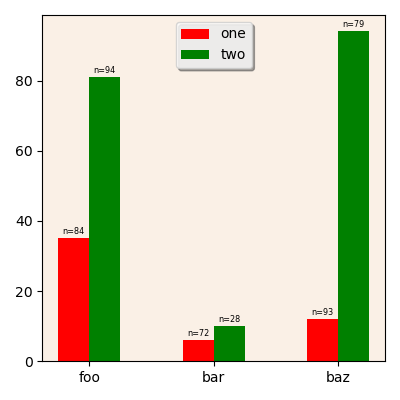
A sample bar plot.
The column parameter indicates which column in the DataFrame
contains the value to plot. The tracks and subtracks parameters
are used to select and distribute the rows along the tracks and
subtracks, in a similar way to the scatterplot function of the
incenp.plotting.scatter module.
The ncolumn parameter, if included, indicates which column in the
DataFrame contains the number of samples, to be displayed on top of
every bar.